


Beef Quality and Yield Grades
By Dan S. Hale, Kyla Goodson, and Jeff W. Savell, Department of Animal Science, Texas Agricultural Extension Service.
Beef Quality Grades
A quality grade is a composite evaluation of factors that affect palatability of meat (tenderness, juiciness, and flavor). These factors include carcass maturity, firmness, texture, and color of lean, and the amount and distribution of marbling within the lean. Beef carcass quality grading is based on (1) degree of marbling and (2) degree of maturity.Marbling
Marbling (intramuscular fat) is the intermingling or dispersion of fat within the lean. Graders evaluate the amount and distribution of marbling in the ribeye muscle at the cut surface after the carcass has been ribbed between the 12th and 13th ribs. Degree of marbling is the primary determination of quality grade.
Degrees of Marbling
Each degree of marbling is divided into 100 subunits. In general, however, marbling scores are discussed in tenths within each degree of marbling (e.g.,Slight 90, Small 00, Small 10).
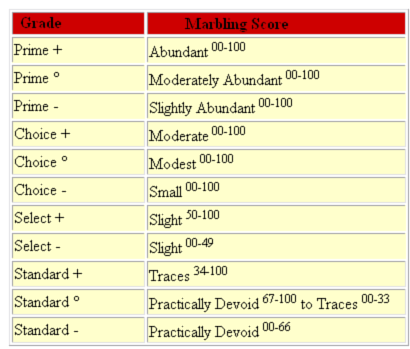
In addition to marbling, there are other ways to evaluate muscle for quality. Firmness of muscle is desirable, as is proper color and texture. Desirable ribeyes will exhibit an adequate amount of finely dispersed marbling in a firm, fine textured, bright, cherry-red colored lean. As an animal matures, the characteristics of muscle change, and muscle color becomes darker and muscle texture becomes coarser.
Maturity
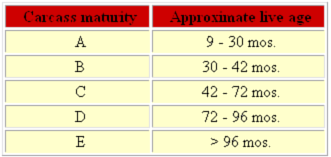
Maturity refers to the physiological age of the animal rather than the chronological age. Because the chronological age is virtually never known, physiological maturity is used; and the indicators are bone characteristics, ossification of cartilage, color and texture of ribeye muscle. Cartilage becomes bone, lean color darkens and texture becomes coarser with increasing age. Cartilage and bone maturity receives more emphasis because lean color and texture can be affected by other postmortem factors.
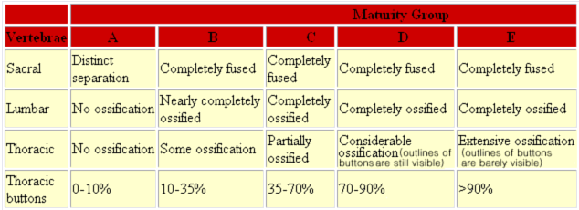
Cartilage evaluated in determining beef carcass physiological maturity are those associated with the vertebrae of the backbone, except the cervical (neck). Thus the cartilage between and on the dorsal edges of the individual sacral and lumbar vertebrae as well as the cartilage located on the dorsal surface of the spinous processes of the thoracic vertebrae (buttons). Cartilage in all these areas are considered in arriving at the maturity group. The buttons are the most prominent, softest and least ossified in the younger carcasses. As maturity proceeds from A to E, progressively more and more ossification becomes evident. Ribs are quite round and red in A maturity carcasses, whereas E maturity carcasses have wide and flat ribs. Redness of the ribs gradually decreases with advancing age in C maturity, and they generally become white in color because they no longer manufacture red blood cells and remain white thereafter. Color and texture of the longissimus muscle are used to determine carcass maturity when these characteristics differ sufficiently from normal.
There is a posterior-anterior progression in maturity. Thus, ossification begins in the sacral region and with advancing age proceeds to the lumbar region and then even later it begins in the thoracic region (buttons) of the carcass. Because of this posterior-anterior progression of ossification, even young A maturity carcasses will have some ossification in the sacral cartilage.
In terms of chronological age, the buttons begin to ossify at 30 months of age. Determine age using thoracic buttons. When the percentage ossification of the cartilage reaches 10, 35, 70, and 90 percent, the maturity is B, C, D, and E, respectively.
Skeletal Ossification
Condition of the bodies of the split chine bones:
A- Red, porous and soft
B- Slightly red and slightly soft
C- Tinged with red, slightly hard
D- Rather white, moderately hard
E- White, nonporous, extremely hard
Appearance of the ribs:
A- Narrow and oval
B- Slightly wide and slightly flat
C- Slightly wide and moderately flat
D- Moderately wide and flat
E- Wide and flat
Lean Maturity:
Color and Texture - As maturity increases, lean becomes darker in color and coarser in texture
Lean Maturity Descriptions

- Use a simple average when bone and lean maturities are within 40 units of each other.
- When there is more than 40 units difference in lean and bone maturity, average the two maturities and adjust the average 10% toward the bone except when:
Crossing the B/C line
- If the average of the lean and bone maturities doesn't move across the B/C line from the bone maturity side (e.g., Bone = B and Lean = C with the average being B or Bone = C and Lean = B with the average being C); average the two maturities and adjust the average to the nearest 10% toward the bone.
- If the bone and lean maturities are not considerably different, but one is in B maturity and the other in C maturity and the average of the two moves across the B/C line from the bone maturity side, the overall maturity will be on the side of bone maturity -- it will be either B-100 or C-00.
- In no case may overall maturity be more than one full maturity group different than bone maturity. A80 lean + D20 skeletal = C20 overall.
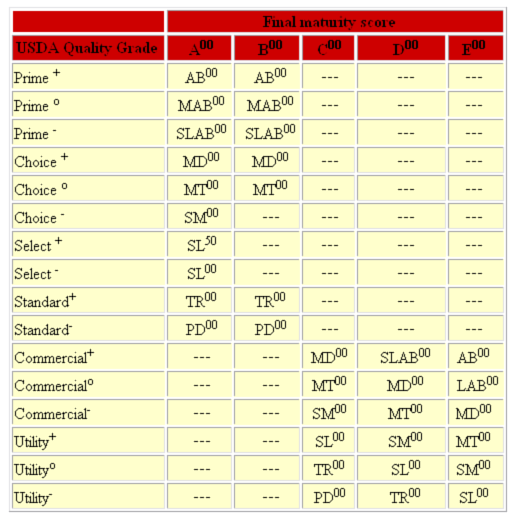
After the degree of maturity and marbling has been determined, these two factors are combined to arrive at the Final Quality Grade. The fundamentals involved in applying quality grades are learning the degrees of marbling in order from lowest to highest and minimum marbling degrees for each maturity group and understanding the relationship between marbling and maturity in each quality grade.
Step-Wise Procedure for Quality Grading Beef Carcasses
1. Determine carcass skeletal maturity by evaluating the degree of skeletal ossification in the top three thoracic vertebra (buttons), and the sacral and lumbar vertebra. Also evaluate the color and shape of the ribs. Determine lean maturity by evaluating the color and texture of the lean in the ribeye exposed between the 12th and 13th ribs.
Skeletal Maturity + Lean Maturity = Overall Maturity
A60 + A40 = A50 (Simple Average)
B60 + A80 = B30 (>40; 10% to bone)
C60 + B10 = C00 (B/C line)
D60 + B20 = C60 (<=100% from bone)
2. Evaluate the marbling in the ribeye and determine the marbling score.
Overall Maturity + Marbling Score = USDA Quality Grade
A70 + Sm40 = Ch-
B60 + Md40 = Cho
3. Determine lean firmness to ensure that the minimum degree of firmness specified for each maturity group is met.
Table illustrating the minimum marbling score requirements for USDA quality grades within each final maturity group

Beef Yield Grades
In beef, yield grades estimate the amount of boneless, closely trimmed retail cuts from the high-value parts of the carcass--the round, loin, rib, and chuck. However, they also show differences in the total yield of retail cuts. We expect a YG 1 carcass to have the highest percentage of boneless, closely trimmed retail cuts, or higher cutability, while a YG 5 carcass would have the lowest percentage of boneless, closely trimmed retail cuts, or the lowest cutability. The USDA Yield Grades are rated numerically and are 1, 2, 3, 4, and 5. Yield Grade 1 denotes the highest yielding carcass and Yield Grade 5, the lowest.
The USDA prediction equation for percent boneless, closely trimmed retail cuts (% BCTRC) of beef carcasses is as follows:

Expected percentage of boneless, closely trimmed retail cuts from beef carcasses within the various yield grades
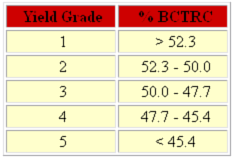
Meat graders assign a yield grade to a carcass by evaluating:
- the amount of external fat;
- the hot carcass weight;
- the amount of kidney, pelvic, and heart fat; and
- the area of the ribeye muscle.
Graders evaluate the amount of external fat at the 12th rib by measuring the thickness of fat three-fourths the length of the ribeye from the chine. They adjust this measurement to reflect unusual amounts of fat in other areas of the carcass. Only graders highly skilled in evaluating cutability of beef carcasses make these adjustments according to whether the measured fat thickness is representative of the fat coverage over the rest of the carcass.
Carcass weight is the "hot" or unchilled weight in pounds (taken on the slaughter-dressing floor shortly after slaughter). The grader usually writes this weight on a tag or stamps it on the carcass. The amount of kidney, pelvic, and heart (KPH) fat is evaluated subjectively and is expressed as a percentage of the carcass weight (this usually will be from 2 to 4 percent of carcass weight). The area of the ribeye is determined by measuring the size (in inches, using a dot-grid) of the ribeye muscle at the 12th rib.
The following descriptions will help you understand the differences between carcasses from the five yield grades: Yield Grade 1
The carcass is covered with a thin layer of external fat over the loin and rib; there are slight deposits of fat in the flank, cod or udder, kidney, pelvic and heart regions. Usually, there is a very thin layer of fat over the outside of the round and over the chuck.
Yield Grade 2
The carcass is almost completely covered with external fat, but lean is very visible through the fat over the outside of the round, chuck, and neck. Usually, there is a slightly thin layer of fat over the inside round, loin, and rib, with a slightly thick layer of fat over the rump and sirloin.
Yield Grade 3
The carcass is usually completely covered with external fat; lean is plainly visible through the fat only on the lower part of the outside of the round and neck. Usually, there is a slightly thick layer of fat over the rump and sirloin. Also, there are usually slightly larger deposits of fat in the flank, cod or udder, kidney, pelvic and heart regions.
Yield Grade 4
The carcass is usually completely covered with external fat, except that muscle is visible in the shank, outside of the flank and plate regions. Usually, there is a moderately thick layer of external fat over the inside of the round, loin, and rib, along with a thick layer of fat over the rump and sirloin. There are usually large deposits of fat in the flank, cod or udder, kidney, pelvic and heart regions.
Yield Grade 5
Generally, the carcass is covered with a thick layer of fat on all external surfaces. Extensive fat is found in the brisket, cod or udder, kidney, pelvic and heart regions.
Step-Wise Procedure for Yield Grading Beef Carcasses
1. Determine the preliminary yield grade (PYG).
Measure the amount of external fat opposite the ribeye. This measurement should be made at a point three-fourths of the way up the length of the ribeye from the split chine bone. Based on this fat thickness, a preliminary yield grade (PYG) can be established. The base PYG is 2.00. The more fat opposite the ribeye, the higher the numerical value of the PYG.
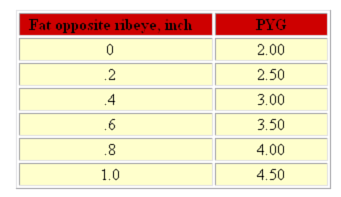
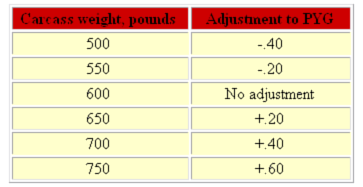
2. Adjust for carcass weight deviations from 600 pounds.
The base weight in the yield grade equation is 600 pounds. If a carcass weighs more than 600 pounds, then we increase the PYG, and if a carcass weighs less than 600, then we decrease the PYG.
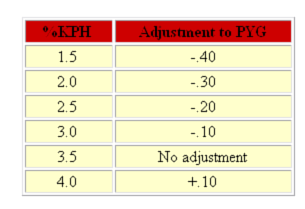
3. Adjust for percentage KPH deviations from 3.5 percent.
It has been determined that the average carcass has 3.5% KPH. If a carcass has more than 3.5% KPH, then the carcass is fatter than the average and the PYG should be adjusted up, raising the numerical yield grade. If a carcass has less than 3.5% KPH, then the carcass is leaner than average and the PYG should be adjusted down, thus lowering the yield grade.
4. Adjust for ribeye area (REA) deviations from 11.0 sq. in.
The average carcass has a ribeye area of 11 sq. in. If a carcass has a ribeye area greater than 11.0 sq. in., then it is probably more muscular then average, and the PYG should be adjusted down to lower the numerical value of the yield grade. If the ribeye area is less than 11.0 sq. in., then the carcass is probably less muscular than average and the PYG should be adjusted up.
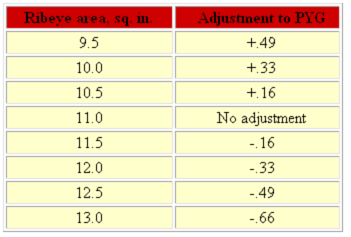
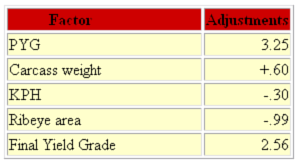
Example yield grade problem using the short cut method:

a. 0.5 in. = 3.25
b. 750 minus 600 = 150 / 25 = 6 X .1 = .6 (add)
c. 3.5 minus 2.0 = 1.5 X .2 = .30 (subtract)
d. 14.0 minus 11.0 = 3 X .33 = .99 (subtract)
May 1998
![]()

