


Australian Beef Industry: Financial Performance to 2005-06
By ABARE Economics - Beef and veal continue to be Australia’s most important agricultural commodity, with a gross value of production of more than $7.4 billion in 2005-06.In contrast, Australia’s live cattle export trade continues to come under pressure from a variety of sources. These include the appreciation of the Australian dollar (particularly against the US dollar, the Indonesian rupiah and the Philippine peso); continued high cattle prices, which affect price competitiveness in key markets; and strong competition from south American beef and Indian buffalo meat in south east Asian export markets. These factors have combined to pull Australian live cattle exports back from the record level achieved in 2002-03.
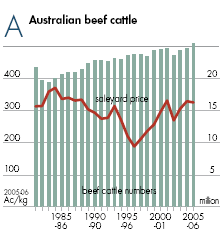 Average farm cash income for Australian broadacre beef producers rose slightly in 2004-05 to just over $61 000 per farm on the back of a further rise in beef cattle prices. However, in 2005-06 farm cash incomes for beef producers are projected to fall by almost 50 percent. Although beef cattle saleyard prices remained high, a major factor contributing to the reduction in average farm cash income in 2005-06 was a 5 per cent fall in the average number of beef cattle sold as producers built up herd numbers. As a result of the increase in the value of on farm livestock inventories, average farm business profit fell by considerably less than the decline in farm cash income and the average rate of return (excluding capital appreciation) was similar to the previous year. The pattern of a large reduction in farm cash income but a relatively smaller fall in farm business profit in 2005-06 was observable for all sub-groups of producers within the beef industry, such as those defined by location, scale of operation or degree of specialisation in beef cattle production.
Herd Rebuilding
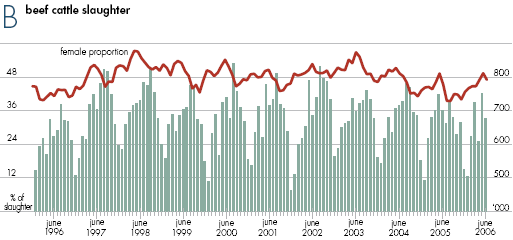
Australian cattle numbers have increased consistently since the 2002-03 drought. The Australian beef cattle herd as at June 2006 is estimated to have been approximately 25.5 million. However, with prices forecast to ease in 2006-07, as trade resumes between the United States and Japan, the impetus for continued herd rebuilding is expected to ease and slaughter rates increase.Over the medium term, Australian beef production is projected to continue to increase. Reflecting this, Australian saleyard prices are expected to ease over the medium term, and Australian beef exports are forecast to rise to 985 000 tonnes by 2010-11. The historically high saleyard prices that prevailed during 2005-06 provided the incentive for producers to rebuild their herds in that year. The increase in herd numbers has been achieved by a reduction in slaughterings, particularly of cows, and a recovery in herd productivity brought about by improved seasonal conditions. Although a strong seasonal pattern is evident, the recent trend shows a reduction in the proportion of female cattle slaughtered (figure B).
Beef Industry in Australia
Beef cattle production is the most widely dispersed agricultural industry in Australia. There are producers across Australia in all three agricultural zones — high rainfall, wheat—sheep and pastoral. Around 90 per cent of the Australian beef cattle herd at 30 June 2005 were on broadacre farms, with the remainder on dairy farms, small scale hobby farms, or farms with a main focus on nonbroadacre activities.Through its coverage of the broadacre sector, ABARE’s annual survey of the agricultural and grazing industries provides extensive information on the Australian beef industry. However, results from previous years have highlighted that there are marked differences in the structure and financial performance of groups of farms within the beef industry. These differences are evident when comparing regions, and farms of different scales and enterprise diversity. As the results for the separate groups are of interest to industry stakeholders, throughout this report the industry results from the ABARE survey are often broken down for groups of producers differentiated by location, size or enterprise mix. However, throughout this report the large scale feedlots have been excluded so as to present a consistent picture of the production and financial characteristics of pastoral beef properties in Australia.
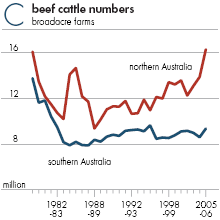
In order to account for the very different climatic environments confronted by Australian beef producers, the industry is separated into northern and southern regions. The northern beef industry includes beef producers in Queensland, the Northern Territory and the Kimberley and Pilbara regions in Western Australia. The southern beef industry includes all other producers. Producers in northern Australia typically operate more extensive pastoral grazing enterprises than their southern counterparts. They have also significantly changed the nature of their beef cattle operations in response to market developments over the past decade or so. In 2005-06, producers in northern Australia accounted for nearly 70 per cent of the Australian beef cattle herd (figure C).
 An estimated 45 200 broadacre farms had beef cattle at 30 June 2005. A little less than half of these farms (46 percent) had beef cattle production as their dominant agricultural activity. Throughout this report, these producers are referred to as ‘specialist beef producers’. Specialist beef producers accounted for around 74 per cent of all beef cattle on broadacre farms in 2004-05.
The other 54 percent of broadacre producers with beef cattle are classified as ‘nonspecialist beef producers’ provided they have more than 50 beef cattle. As they have a much heavier focus on other agricultural activities, the financial performance of this group is less reliant on conditions in beef cattle markets. Consequently, the survey results for this group of producers are reported separately.
The beef industry is very different from other Australian broadacre industries, such as the grains industry, in that there are a very large number of small scale producers (figure D).
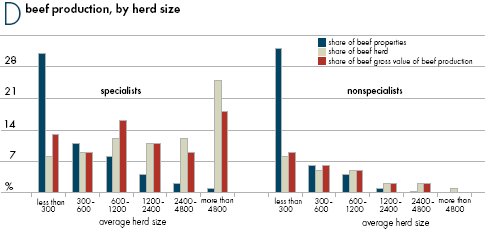
Many of these producers often do not operate with the scale necessary to benefit from the introduction of the latest herd or farm business management practices. They often rely on non-farm sources of income for their livelihood and in some regions their land values are higher than warranted by agricultural returns alone due to amenity value or the potential for future subdivision. These factors distort many of the financial performance indicators used to monitor the performance of the industry. Consequently, the specialist beef producers are separated into small and large producers using a threshold of 300 beef cattle. While around 30 per cent of beef producers are classified as small beef specialists, collectively they account for just 13 percent of the value of beef production.
Herd Productivity
A feature of the Australian beef cattle industry over the past three decades has been the improvement in herd productivity. Average death rates (annual deaths as a proportion of the farm’s herd) have trended downwards since 1977-78, especially in northern Australia (figure E). At the same time, branding rates have trended upwards across Australia (figure F). Improved genetic characteristics of livestock, increased use of Bos indicus cattle, and improved pasture, herd and disease management have all been significant factors in boosting herd productivity.
The turnoff rate of beef cattle operations in northern Australia has increased from 25 per cent in the late 1970s to between 35 and 38 per cent over the past six years, largely owing to the growth in the feedlot sector and the live export markets (figure G). These avenues for selling beef cattle in northern Australia have allowed producers to turn off younger cattle. Producers have responded to this by altering herd composition in order to boost calf production.
The long term trend of increased branding rates is also observable in southern Australia where improved pasture and herd management practices have been contributing factors. However, herd expansion has caused a steady decline in turnoff rates in the decade leading up to the 2002-03 drought, especially compared with northern Australia. Since then, southern Australia has had a steady increase in turnoff rates as producers responded to historically high saleyard prices.
Farm Financial Performance
specialist beef producers
The average farm cash income for specialist producers with more than 300 beef cattle fell by more than $60 000 to just $26 500 in 2005-06. Farm business profit also fell but by a smaller amount owing to an increase in the value of livestock held on farm. The factors behind the drop in income are different for producers in northern and southern Australia. Consequently, in this section, estimates are discussed separately for large specialist producers in northern and southern Australia.
large specialist beef producers – northern Australia
Beef producers in northern Australia operate farms that are generally much larger and less diversified than producers in southern Australia. The drought that began in 2002-03 led to a sharp reduction in cattle numbers (figure C) in northern Australia. Although cattle numbers have increased since then, a continuation of poorer than average seasons combined with herd rebuilding efforts has subdued farm cash incomes in northern Australia in recent years (figure H).
This was despite strong international demand for beef and veal and high saleyard prices. Northern beef producers have become increasingly dependent on the live export market over the past decade, although this market, as discussed above, has come under pressure in recent years. However, increased feedlot demand has partially offset the effect of reduced demand from the live export market and contributed to a continuation of favorable beef cattle prices in recent years.
In 2004-05, farm profitability for northern large specialist beef producers continued to recover following the drought that commenced in 2002-03. This is the result of an increase in the average number of cattle sold and higher prices, which contributed to a 12 percent increase in beef cattle receipts. However, farm cash income was subdued by a 16 per cent increase in the cost of beef cattle purchases, and the higher cost of fodder, fuel and freight, handling and marketing.
It is estimated that northern large beef specialists experienced even tighter cash flows in 2005-06. However, farm profitability is expected to have remained relatively unchanged as increases in the value of livestock offset the effects of lower farm cash incomes (table 1, figure H). 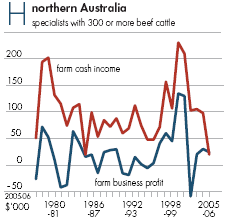 Average farm cash income is expected to have fallen by 80 percent in 2005-06 as herd rebuilding efforts led to a reduction in the number of cattle sold and farm cash costs continued to increase.
Farm cash costs are estimated to have been 5 percent higher, largely as a result of increased beef cattle purchases to augment herd rebuilding through natural increase. Interest payments for these producers also increased by an estimated 50 percent, reflecting higher debt levels than in previous years.
large specialist beef producers – southern Australia
In 2004-05 the financial performance of large beef specialist producers in southern Australia benefited from improved seasonal conditions and higher commodity prices (figure I). 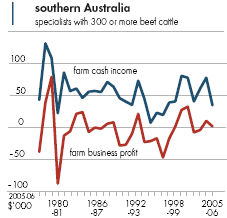 Producers in southern Australia used the improvement in seasonal conditions to boost cattle sales by 5 per cent. This, combined with a 13 per cent rise in prices received, led to an 18 percent increase in beef cattle receipts to average $270 600 a farm (table 1).
Farm costs increased by 18 per cent in 2004-05, as many large specialist beef producers in southern Australia accelerated herd rebuilding by increasing cattle purchases. The relatively high number of cattle purchased may also indicate that these producers are bringing in stock from other properties for fattening or finishing for market.
Average farm cash income for southern large beef specialist producers rose by 28 percent and farm business profit also improved and became positive in 2004-05. In 2005-06, farm cash income is expected to have more than halved as producers reduce cattle sales and farm cash costs continue to rise. The projected reduction in total cash receipts is almost entirely the result of lower beef receipts. Farm business profit is also expected to have fallen to close to zero.
Small Specialist Beef Producers
Beef cattle specialists with fewer than 300 beef cattle operate relatively small farms, with very little cropping and only a small number of sheep (table 1). In 2005-06, the average number of beef cattle on hand at the end of the financial year fell by around 10 percent to 132 head. In line with a smaller herd and fewer beef cattle purchases, the average number of beef cattle sold also fell and beef cattle receipts were well down on the previous year. To some extent, the reduction in receipts was offset by lower costs, particularly the cost of beef cattle purchases and freight, handling and marketing. However, average farm cash income fell to around $1600.Over the past decade small specialist beef cattle producers in Australia have recorded very modest average farm cash incomes. The best outcome over this period was in 2004- 05 when average farm cash income was around $11 000. Furthermore, in the 28 years that ABARE has collected detailed survey data on this industry, small specialist beef cattle producers have on average, never made a profit, and losses have been around $40 000 a year for the past sixteen years (figure J).
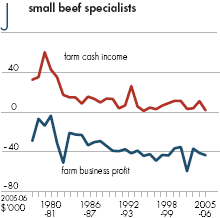 The average rate of return excluding capital appreciation for this group of producers has also been consistently negative over the same time period.
Given the difficulties that this group of producers has in generating income from their beef enterprise, off-farm income is often very important for these farm households. Small specialist beef cattle farms are generally located in southern Australia and are often in relatively close proximity to towns and regional centres. This can provide these producers, or their spouses, with the opportunity to work off-farm. The average off-farm income from wages for the operator and spouse on small specialist beef cattle farms was around $24 400 in 2004-05. This was significantly higher than all other beef producers across Australia, including large specialist beef producers in southern Australia.
Since the 2002-03 drought, between 4 and 5 percent of small specialist beef producers in each year have reduced their involvement in farming by disposing of land. For example, in 2004-05, over 4 percent of these beef producers sold land — on average, disposing of 412 hectares, or 66 percent of their total area operated at 1 July 2004. nonspecialist producers Compared with the specialist beef producer groups reported above, nonspecialist beef producers operate much more diversified enterprises. In addition to the beef cattle enterprise, significant resources are dedicated to crops, wool and sheep and lambs for slaughter (table 1). Even though seasonal conditions improved and beef cattle prices were slightly higher in 2004-05, the financial performance of nonspecialist producers was very similar to the previous year (figure K).
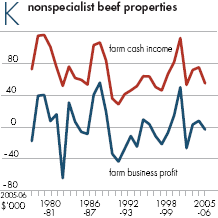 Through improved natural increase, producers were able to increase beef cattle sales as well as retain additional stock to increase herd numbers. A 10 percent increase in average price received per head of cattle in conjunction with a 5 per cent rise in the number of beef cattle sold resulted in beef cattle receipts increasing by 16 per cent to $99 400 in 2004-05.
In 2004-05, a dry start to the season resulted in nonspecialist producers planting 10 percent less area to crops compared with 2003-04. This, combined with weaker prices, led to a 14 percent fall in crop receipts. This served to offset the effects on farm revenue of higher beef cattle receipts. However, farm cash costs remained relatively unchanged in 2004-05, as higher freight and fuel costs were offset by lower outlays on fertilisers and chemicals, and, hence, the farm cash income result in 2004-05 was similar to the previous year.
In 2005-06, farm cash income is expected to have fallen by 27 per cent, principally reflecting reduced beef cattle receipts. Beef cattle receipts are expected to have fallen by 14 percent as prices weaken and further herd rebuilding results in fewer cattle being sold. However, it is notable that this group of producers appears to be choosing to increase beef cattle numbers in preference to rebuilding sheep numbers.
Financial Performance, By State
In 2004-05, specialist beef cattle producers’ average farm cash income improved in all states except the Northern Territory and Western Australia (table 2), as improved seasonal conditions in most regions boosted herd productivity and reduced drought related expenses. In the Northern Territory, incomes fell by 57 percent as dry conditions continued to affect herd productivity and increased outlays on fodder.In 2005-06, average farm cash income is expected to have deteriorated markedly in all states. In some states, this is because herd rebuilding has constrained livestock sales. In other states, the deterioration of their farm cash income is expected to have resulted from increasing farm costs. In all states, other than Queensland, farm business profit is also expected to have fallen significantly . However, in general, the fall in estimated farm business profit was smaller than the drop in farm cash income. This reflects an increase in the value of trading stocks as a result of herd rebuilding. In Queensland, the amount of herd rebuilding and the consequent increase in the value of trading stocks was sufficient to more than offset the drop in farm cash income in 2005-06.
Rates of Return
The rapid rise in rural land values since the beginning of this decade has meant that the capital value of beef properties has risen more rapidly than farm profitability. Consequently, this has served to reduce the rates of return excluding capital appreciation recorded by this sector. One characteristic of the Australian beef industry is that farm cash income and the return on capital (excluding capital appreciation) tend to increase in line with the size of the farms’ beef cattle herd (figure L and table 3).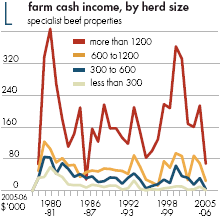 For example, specialist beef producers with more than 1200 head of cattle generated a return on capital and management (excluding capital appreciation) of between 1.4 and 2.3 percent over the past three years. In contrast, specialist beef farms with fewer than 300 head of cattle have consistently recorded a negative rate of return.
Characteristics of the Better Performing Specialist Beef Producers
In this analysis the average rate of return, excluding capital appreciation, was chosen over other alternative measures to rank producers according to their farm financial performance over the period 2003-04 to 2004-05. This measure enables comparison of performance between farms that have quite different soils, rainfall, resource quality and stage of development. Differences in the productive capability of land are reflected in land value, the major component of total farm capital. Additionally, return on total assets is calculated using profit before allowance is made for interest and taxation payments, enabling comparison between all farms regardless of their financing arrangements. Only large beef specialists with 300 or more beef cattle are included in this analysis.The better performing farms in the 2003-04 to 2004-05 period were characterised by larger farm areas and superior herd productivity as reflected in the higher branding rate. The better performing producers across Australia operate businesses generating substantial farm business profits and strongly positive rates of return, both excluding and including capital appreciation.
From 2003-04 to 2004-05, the operators of the better performing farms managed significantly more productive herds with more calves being branded per 100 cows mated. This may indicate that the better performing farms were less affected by the drought that commenced in 2002-03, or that the operators of these farms implemented superior drought management strategies.
Furthermore, the better performing producers were able to realise significantly higher average prices for cattle. Between 2002-03 and 2004-05, the premium averaged $160 per head in northern Australia and $285 per head in southern Australia. This could have been caused by many factors, including the turnoff of well conditioned cattle, better timing of sales to coincide with higher prices or the targeting of different markets requiring the sale of animals of different age and weight. The combined effect of higher productivity and prices is that the better performing farms generated significantly more revenue. Over the period 2003-04 to 2004-05, average farm cash receipts per hectare operated on the better performing farms in southern Australia was nearly three times that of the poorer performing farms. In northern Australia, the difference between the receipts per hectare operated of the top 25 percent and the bottom 25 per cent of farms was more than $3 per hectare, a difference of 35 percent. When comparing the composition of costs between the better and poorer performing farms across Australia, the better performing farms spent considerably more on beef cattle purchases. This, in conjunction with the estimated percentage change in beef herd size, suggests that they have begun rebuilding their herds following the drought that commenced in 2002-03. It is also possible that some producers in the group of top performing farms may be engaged in purchasing cattle and fattening them for resale.
Overall, the better performing farms in southern Australia had higher costs per hectare compared with the poorer performing producers. However, this was more than offset by their higher receipts received per hectare. Consequently they recorded significantly higher farm cash income in both absolute and per hectare operated terms.
In northern Australia, cash costs per hectare were similar for the two groups. In that region, the higher receipts per hectare is the key factor contributing to the bottom line result. The top 25 per cent of producers in northern Australia also spent proportionally more on beef cattle purchases compared with the bottom 25 percent of producers. This, along with the higher average branding rate and marginally lower turnoff rate, is likely to be a major factor behind the increase in average herd numbers by these producers over that two year period.
Strong cash flows, high farm business profits and possibly a greater propensity to utilise debt financing have resulted in the better performing farms investing more in new farm capital compared with the poorer performing producers. These investments would be expected to boost future production capacity and profitability. Over the two years to 2004-05, annual net capital additions (defined as capital purchases less sales) for the better performing farms averaged $250 200 in northern Australia compared with $9500 on the poorer performing farms. The equivalent data for southern Australia was $17 800 for better performing farms compared with nearly $400 on the poorer performing farms.
Land Values
Since the 1990s, a record number of beef cattle producers have reacted to rising profitability and low interest rates by acquiring more land to expand their farm’s production capacity. As a result of growing demand for land from the beef industry, other agricultural industries and nonagricultural land uses, the value of Australia’s broadacre agricultural land is now much higher than it was in 2001-02 (figure M). 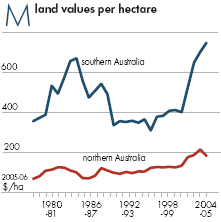 Large beef cattle producers in both southern and northern Australia have been pursuing this strategy. In each of the last five years, 9 percent of large scale beef farms in southern Australia acquired land, with the average purchase costing $1.8 million. This compares with 10 percent of large scale beef cattle producers in northern Australia acquiring land at an average cost of $2.5 million. In contrast, between 4 and 5 per cent of small scale beef producers in southern and northern Australia acquired land during the period 2000-01 to 2004-05 and spent less than $450 000 a year.
For the full document including tables 1-3 click here.
October 2006 ![]()


