


Fertiliser Use In Ireland On Grass And Arable, 2004-2008
This survey uses National Farm Survey (NFS) data on the amount and types of chemical fertiliser used by the farmers for different crops to determine the amounts of nitrogen(N), potash (P) and potassium (K) nutrients and types of fertiliser used on grassland and arable crops.EXECUTIVE SUMMARY
National Farm Survey: Farm management data for the years 2004-2008 from the Teagasc National Farm Survey (NFS) were used as the basis for this fertiliser use survey. The farms that took part in the survey were a stratified random sample selected to represent the major farm systems and sizes. Farms were classified into 6 main farm systems namely: dairying, dairying with other enterprises, cattle rearing, cattle with other systems, mainly sheep and tillage systems. These systems refer to the dominant enterprise in each group. However, in order to simplify the large number of tables in this document, the farm types were further reduced to four farm systems; namely dairying, cattle, sheep and tillage.
Data analysis: The data from farms were analysed using the SAS statistical package. Two and three-way tables were produced relating N, P and K fertiliser use for different crops to geographic region, farm enterprise, farm size, stocking rate and soil suitability class. The mean values obtained for different crops were weighted according to the area of the crop on the farms in question. A total of 1232 farms were included in the survey in 2008. The survey was carried out following the definitions of terms appropriate to the national farm survey. Some of these, for example livestock units (LU), farm area, stocking rates and N usage are not calculated in the same way as those used in other contexts such as national area-aid schemes, and thus cannot be compared with them. A glossary of terms is included in Appendix 5 in order to avoid misunderstandings of the meanings of such farm parameters.
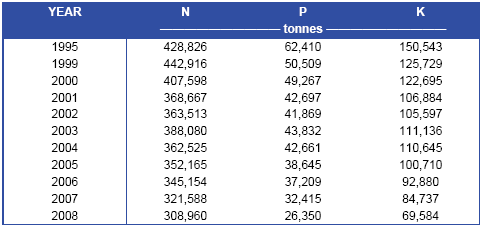
Validation: An overall validation procedure for the survey results was performed by comparing annual sales of N, P and K fertiliser for 2008 with the amount calculated from the survey results for N, P and K usage for different crops, taken together with the published national areas under these crops. The agreement between the calculated fertiliser consumption from the survey and the nationally published figures of 308,960 tonnes of N, 26,350 tonnes of P and 69,584 tonnes of K was remarkably good with errors of only -1.1 per cent, -1.4 per cent and -0.5 per cent for the three elements. The agreement indicates that the results of this fertiliser use survey are valid.
Nutrient Advice: Results from 52,350 soil samples submitted to Teagasc for soil analysis in 2008 together with Teagasc nutrient advice allowed the mean Teagasc fertiliser recommendation to be calculated for different crops. The mean advice levels were compared with the mean usage rates of N, P and K from the survey on the assumption that the soils of the farms surveyed had the same distribution of soil analysis levels and soil Index levels as the laboratory samples.
Grazing: The average usage of fertiliser nutrients applied to grazed grassland was estimated at 65, 3 and 9 kg/ha for N, P and K respectively. The nutrient usage, particularly N, was greater in the southern regions of the country than that used in the other regions. The mean N usage for grazing was 38 per cent lower than that estimated for 2003. There was a 63 per cent decrease in P usage, and a 50 per cent decrease in K usage since 2003. Although the fertiliser usage on dairy farms was higher than that of other systems, the usage of N, P and K was below the estimated Teagasc advice rates for all farms at all stocking rates. 6. Silage: The estimated mean N, P and K usage for silage was 101, 7 and 24 kg/ha respectively. This represents a decrease in fertiliser usage since 2003 of 16 per cent for N, 46 per cent for P, and 41 per cent for K. These decreases are line with the national decreases in fertiliser sales during this period of 20 per cent, 40 per cent and 37 per cent for N, P and K respectively. The N, P and K application rates were higher for silage on dairy farms than on farms which were mainly cattle, sheep or tillage. Comparison between the calculated Teagasc advice and the nutrient usage for the farms in the survey showed that the P and K usage rate was between the rates advised with and without slurry. The usage rate of N was lower than the advice assuming slurry application.
Hay: The mean N application rate on the farms in the survey was 54 kg/ha, while the P and K usage rates were 6 and 17 kg/ha respectively. The usage of N has remained constant since 2003, however, the P and K usage have decreased by 46 and 32 per cent respectively during this period.
Types of fertilisers: The types of fertilisers used for grassland shows a continuing trend towards relying on high N fertiliser compounds (e.g. 24-2.5-10 and 27-2.5-5) rather than high P K compounds (e.g. 0-10-20 and 0-7-30) to supply the P and K for both grazed and cut swards. The use of straight N fertilisers (CAN and urea) has also increased. This has resulted in the relatively larger decrease in the usage of P and K than that of N. This trend has also been noted in previous surveys.
Trends in fertiliser usage: Nitrogen usage for grassland increased from 1995 to 1999 but decreased steadily from 1999 to 2008, this is broadly in line with the changes in the national N fertiliser consumption. The decreasing P and K usage on grassland also closely mirrored the changes in national consumption of these elements. The reduced costs on farms arising from decreased fertiliser inputs is a major benefit to farmers, and may indicate that improvements are being made in how efficiently farmers are utilising nutrients on farms. However, ensuring that soil fertility levels are sustained and balanced into the future remains a key concern.
Winter Wheat: The mean N, P and K application rates were 179, 19 and 52 kg/ha respectively. The estimated usage of N was between the calculated Teagasc advice for 9 and 11 t/ha crop yields. The estimated P and K usage respectively were below the calculated Teagasc P and K advice. The usage of all three major nutrients has decreased since 2003. The largest decrease was with P usage (17 per cent), while N and K usage also decreased by 12 and 5 per cent respectively.
Spring Wheat: The mean N, P and K application rates were 139, 20 and 49 kg/ha respectively. The N usage on the Survey farms compares closely with calculated Teagasc advice. The use of fertiliser of P and K for spring wheat was lower than Teagasc advice. The N use decreased since 2003 by 13 kg/ha (9 per cent). The P and K usage also decreased. 12. Winter Barley: The mean N, P and K application rates were 163, 25 and 64 kg/ha respectively. The mean N application rate on farms in the survey was higher than the calculated mean Teagasc advice of 143 kg/ha. Calculated Teagasc P advice levels matched almost exactly the rates used, while K usage was less than that advised. The mean N usage for winter barley showed a small decrease of 2 per cent compared to 2003. The P and K usage showed larger decreases of 17 and 10 per cent respectively compared to 2003.
Spring Barley: The mean N, P and K application rates were 118, 21 and 45 kg/ha respectively. The usage of N was close to that advised, while P and K usage was below the calculated advice rates. Since 2003, N usage decreased slightly by 4 per cent, while P and K usage showed larger decreases of 19 and 18 per cent respectively.
Malting Barley: The mean N usage was 117 kg/ha, which was 5 kg/ha higher than in 2003. The usage of P on malting barley was 16 kg/ha, and has decreased by 20 per cent since 2003. The usage of K of 48 kg/ha has decreased by 13 per cent since 2003.
Winter Oats: The mean N, P and K usage on winter oats was 141, 23 and 51 kg/ha respectively. Compared with 2003, N usage increased slightly by 3 kg/ha, while both P and K usage decreased by 3 kg/ha. The N usage was above the calculated Teagasc advice, while P usage was similar. The K usage was only 54% of the calculated advice rate. 16. Spring Oats: Spring oats had the lowest fertiliser use of any cereal crop, with mean N, P and K usage of 75, 11 and 23 kg/ha respectively. Compared with 2003, N usage decreased by 34 per cent, while P and K usage both decreased by 56 and 53 per cent respectively. The N usage was above the calculated Teagasc advice, while P usage was similar. The K usage was only 54 per cent of the calculated advice rate.
Cereal Crops: The fertiliser usage over all cereal crops was 137, 20 and 48 kg/ha for N, P and K respectively, representing a decrease in the usage of all three nutrients by 10 per cent for N, 20 per cent for P, and 14 per cent for K.
Root crops: The calculated mean N, P and K usage on all root crops was 106, 46, and 138 kg/ha for N, P and K respectively. The usage was below that of 2003 for all nutrients. However, direct comparisons between these years should only be made in the context of the difference in crop mix during this period with the disappearance of the sugar beet crop. 19. Forage maize: The N, P and K usage for forage maize was 152, 41 and 96 kg/ha respectively. The usage of N, P and K has increased compared with 2003. Maize is the only crop in the survey that has shown an increase in the usage of all three fertiliser nutrients during this period. The N and P usage compared closely with calculated Teagasc advice, while K usage was below the rates advised, assuming no slurry is applied. 20. REPS: The fertiliser N, P and K application rates for grassland and tillage crops on REPS farms were lower than the rates used on non-REPS farms. For grazing, REPS farms used 51 per cent of the N rate and 50 per cent of the P rate of non-REPS farms. For silage the comparison was 78 per cent and 88 per cent for N and P and for hay it was 61 per cent and 71 per cent respectively. REPS farms also had lower N and P usage than non-REPS farms for all cereal and root crops, with the exception of barley and potatoes.
TABULAR SUMMARY OF RESULTS
Table 1. Fertiliser usage on grassland in 2008

Table 2. Fertiliser usage on tillage crops in 2008
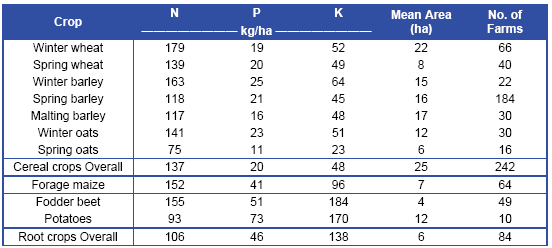
Table 3. Mean fertiliser nutrient use for grassland from 1995-2008
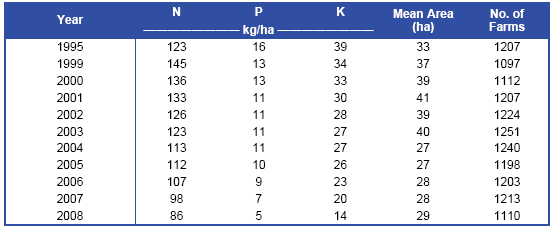
Table 4. Mean fertiliser nutrient use for tillage crops from 1995-2008
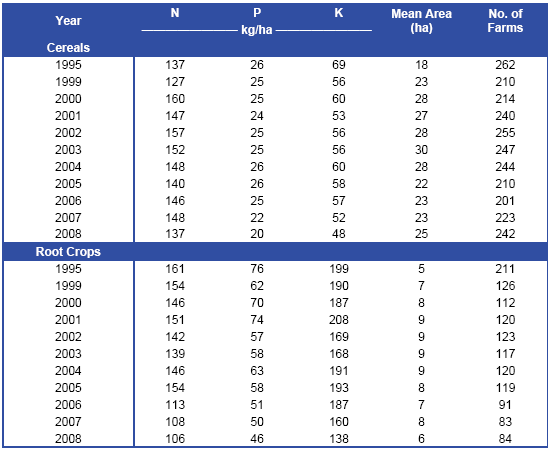
Table 5. National sales of N P and K fertilisers from 1995 to 2008 (DAFF, 2009)
Further Reading
| - | You can view the full report by clicking here. |

