

Practical Tools to Measure and Monitor Variation
Variation can be a major issue on large dairy herds in the Western US. Too much variation is definitely bad, leading to fluctuations in production and health disorders, claims reserach by W.K. Sanchez, Ph.D., J. Mikus, Ph.D., and W. C. Stone, DVM, Ph.D. Diamond V Technical Services and Field Research. This feature was taken from the proceedings of the High Plains Dairy Conference. A full link to the proceedings is provided below.Introduction
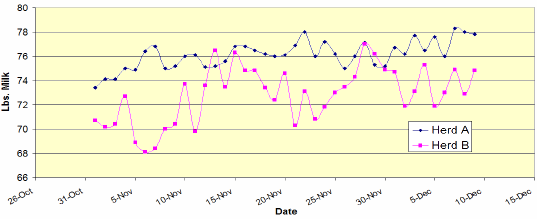
As an example, the 2 dairies shown in Figure 1 milk around 600 cows. Herd A has much more consistent daily production than Herd B, with production usually varying by less than a pound. A BST production cycle is evident in Herd B, along with several 3-4 pound daily production swings. Variation in the feeding program could easily account for the production variation evident in Herd B. Herd A monitors load preparation on a daily basis; whereas Herd B does not.
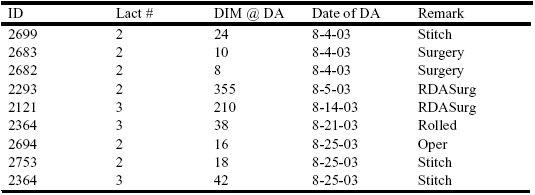
In Table 1, notice how the displaced abomasums (DA) are grouped by date. Many times health disorders are linked to variation in feed preparation. Ketosis, rumen acidosis, laminitis, and probably even hemorrhagic bowel syndrome can occur from excessive variation in the consumed ration.
As costs to operate large Western dairies continue to escalate it will be important for nutritionists to better understand, measure, and monitor variation on the dairy. Tightening variation should translate into more efficient operations and improved profits. This paper will focus on practical examples of variation and introduce monitoring tools that the authors have been using in the field. Specifically, we will show examples related to variation in forage dry matter (DM), dry matter intake (DMI), and milk components; discuss the use of statistical process control charts; and examine a large dataset of Western dairies to determine the typical variation across the lactation cycle.
Vatiation In Forage Dry Matter
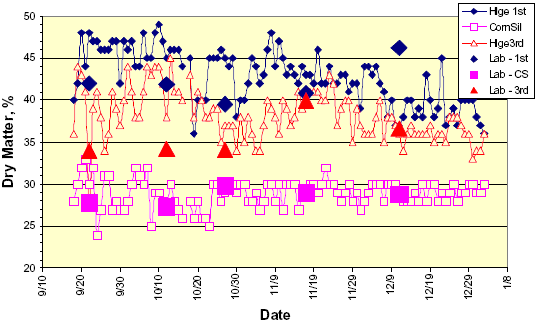
Figure 2 contains daily DM from 2 haylage and 1 corn silage bunker silo (Stone, 2003). All forages were premixed in the mixer wagon and the sample for analysis obtained from the discharged feed. On-farm DM measurements were obtained with a Koster tester. Laboratory DM measurements (larger solid shapes) were also included. Note the general variation that is occurring. First of all, there is more DM variability in the haylages than in corn silage; this is expected considering the manner in which both crops are harvested. Laboratory and on-farm DM measurements for corn silage were essentially identical.
They were very close for all measurements for the third cutting with the exception of the October 12 measurement. Laboratory DM measurements were consistently lower in the first cutting for the first 4 measurements, while the Dec. 17 result was inexplicably higher than the on-farm number. Ideally, split samples would be taken and measured on-farm and sent to the lab. These lab samples were taken from the premixed silage pile by another farm employee, and were not split. If a systematic bias was found between laboratory and on-farm DM measurements, as appears to be happening with the first cutting, then the farm derived DM could be proportionately adjusted.
Variation in Daily Milk Weights - Two Herds
However, with the apparent lab error on Dec. 17, a correction would have resulted in more than a 10 percentage unit variation in estimated DM of first cutting haylage. Obviously this could have large negative effects if new rations were formulated with these adjustments.
Vatiation In Dry Matter Intake
Figure 3 contains an example of variation in intakes. Shown are daily DMI from an 80-cow pen of Holstein cows. Forage DM were determined weekly before 9-20, and daily thereafter. All forage was briefly premixed in the mixer wagon, unloaded, and then used in load preparation. Some of the apparent spikes in DMI (e.g. 11-21, 11-29, and 12-13) occur on approximate increments of seven, and are probably related to weekly animal movements. The decreases in intakes occurring around 10-20 and 12-20 were correlated with an increase in new corn silage and an outbreak of winter dysentery, respectively. Actual intakes can and should be within 5 % of predicted intakes (based on experiences with Cornell Net Carbohydrate and Protein System), or some on-farm investigating and possibly a ration adjustment may be needed.
Table 1. The occurrence of displaced abomasums (DA) in a New York dairy.
The real question to consider when looking at data like these in the above figures is ‘are the changes normal or do they represent real change?’ To answer this question we can turn to Statistical Process Control (SPC) techniques.
Statistical Process Control Techniques To Determine When A Real Change Occurs
Statistical Process Control involves using statistical techniques to measure and analyze the variation in a process. Several researchers (Lukas et al, 2005; Dooley et al, 1997) have used SPC techniques to separate random variation from true changes. Originally developed for use by manufacturing industries, SPC shows promise for dairies wherever:
- Routine measures of management (i.e. milk production, DMI, bulk tank components) can be made, or better yet, are already being made; i.e. free information;
- Timeframe/seasonality can be determined and predicted; and
- Variability of the response measure will be equal to or less than the desired observed response in a controlled setting.
The intent of SPC is to monitor a process and correct it when it gets out of control. A primary tool used for SPC is the control chart, a graphical representation of certain descriptive statistics for specific quantitative measurements of the manufacturing process. These descriptive statistics are displayed in the control chart in comparison to their in-control sampling distributions. The comparison detects any unusual variation in the process, which could indicate a problem.
Figure 4 includes the data in Figure 3 with SPC techniques applied. The terminology used in SPC charts includes XBAR (mean); sigma (nearly equivalent to a standard deviation), UCL and LCL (upper and lower confidence intervals equal to +3 and -3 sigma away from the mean; and various SPC rules. The areas between 1-2 sigma and 2-3 sigma away from the mean are sometimes referred to the B and A zones, respectively.
As we saw in Figure 3 there are obvious differences when looking at the chart. However by applying different SPC rules, other real changes that are not as easy to notice by eye can be picked up days before the obvious ones appear (circled data annotations in Figure 4). This allows quicker corrective action, more stability in the process and likely increased profit on the dairy.
Using SPC Techniques On Milk Component Data
Dry matter intake data are sometimes not recorded on a regular basis. However, milk components are normally analyzed in each shipment of milk and can be collected from processor websites. Milk fat data can often be used as a proxy for monitoring the feeding program. This is because there is often a link between milk fat percent in the bulk tank and variation in the feeding program. Using SPC techniques can be a valuable aid in monitoring milk components; and thus related changes in feed programs.
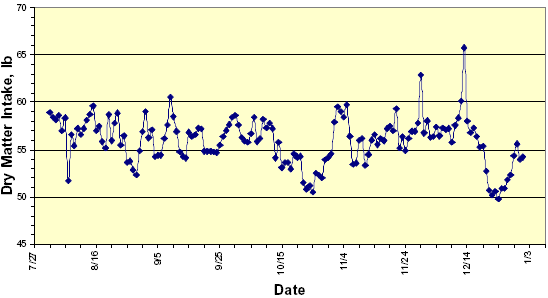
Daily DMI in a Pen of Holsteins
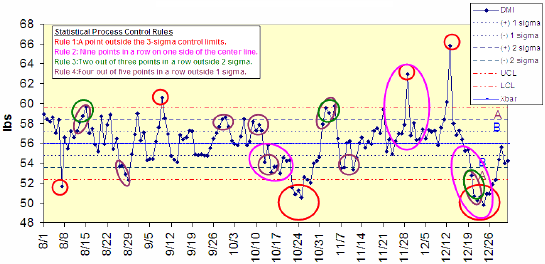
Figure 5 shows a screen shot of an SPC tool that Diamond V has been developing to monitor milk components. The chart shows 30 average weekly milk fat averages from a dairy. The mean, UCL, LCL, and sigma values are indicated and determined from the last 20 points in the data set (the open circles are not used in the SPC calculations). The large square symbols indicate when a real change has occurred. For example, the last 4 wk signify a real (and positive) change in milk fat. Often milk processors include several past years of data, which can be useful to determine if the recent changes are due to seasonal patterns or something else (like a nutritional change).
A Database From Large Western Dairies For Use In Monitoring Milk Components Across The Lactation
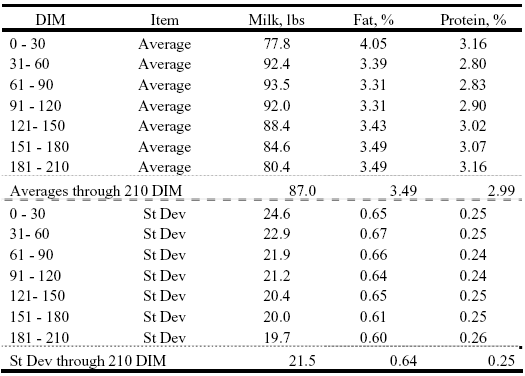
Once a real change in milk components is found it would be valuable to know if the changes are specific to a certain stage of lactation or to the whole lactation in general. To help answer this question we assembled data from 9 large Western US dairies to determine average milk components across different stages of lactation. The goal was to collect current data from a large population of cows. The database consists of monthly milk, fat, and protein records from 27,415 Holstein cows and has a range in production averages typical of many dairies in the Western US. Table 2 shows the average and standard deviations in milk fat %, milk protein %, and lb of milk between 0 and 210 days in milk (DIM). Figures 6, 7, and 8 show the individual herd averages for milk, milk fat, and milk protein; respectively.
The information in Table 2 and Figures 6 - 8 may be useful in determining if a herd has higher than normal variation and if that variation is within a specific category of DIM. One interesting finding we discovered was that the highest standard deviations in milk yield occurred during the 0 – 30 DIM period, but then decreased steadily throughout lactation. This was consistent in 8 out of 9 herds (1 dairy had the highest standard deviations in milk yield during the 31 - 60 DIM period).
Milk Fat Control Chart
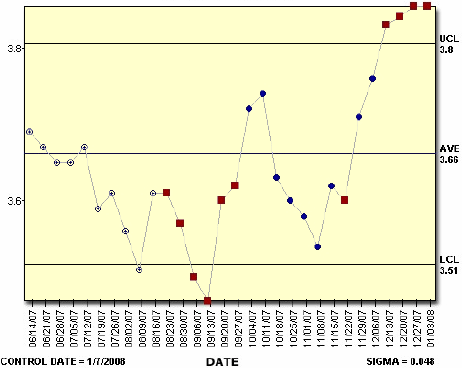
Figure 5. Weekly milk fat % data in bulk tank shipments from a large western US dairy with SPC charting techniques applied to the data.
Table 2. Averages and standard deviations of milk production and components in a database from 9 Western US dairies; n = 27,415 cows, DIM = days in milk, St Dev = standard deviation.
Milk Yield, lbs Across DIM
In 9 Large Western Dairies (n=27,415 cows); each symbol represents a dairy
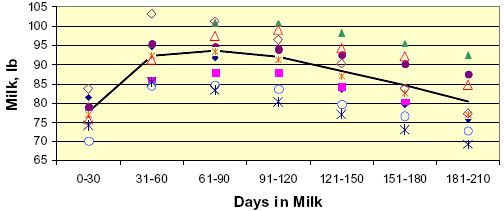
Figure 6. Milk yield averages in 9 Western US dairies; n = 27,415 cows.
Milk Fat, % Across DIM
In 9 Large Western Dairies (n=27,415 cows); each symbol represents a dairy
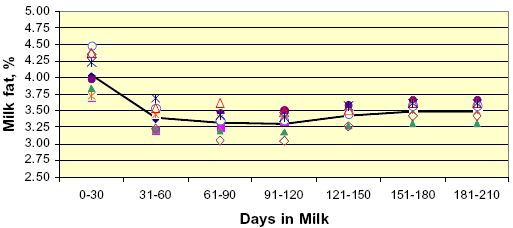
Figure 7. Milk fat % averages in 9 Western US dairies; n = 27,415 cows.
Milk Protein, % Across DIM
In 9 Large Western Dairies (n=27,415 cows); each symbol represents a dairy
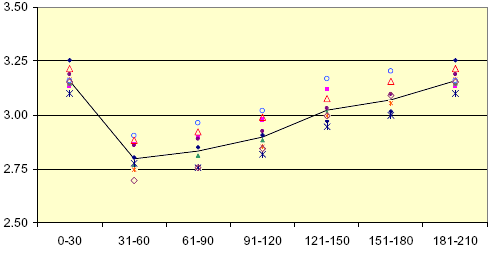
Figure 8. Milk protein % averages in 9 Western US dairies; n = 27,415 cows.
Conclusions
There are lots of examples of variation on large dairy herds. Understanding, measuring and monitoring variation should enable dairies to become more consistent in key areas that impact profits. These include forage DM, DMI, and milk yield and components. Using statistical process control techniques in these areas can determine when a real change occurs. Finally, a summary from large Western dairies shows that the highest variation in milk yield consistently occurs in the early phases of lactation.
Further Reading
| - | You can view the full conference proceedings by clicking here. |
August 2008


