

Higher Cattle Market Volatility: What Does This Mean?
Producers know too well that cattle prices have been soaring at record levels, but how does this look as we say farewell to 2014?High prices mean higher risk, with volatility increasing over recent times, according to one Mississippi State University economist.
As markets have steadied, and even declined in recent times, volatility has diminished slightly.
This is expected since a steady market is also viewed as a less risky one and therefore volatility measures should fall, writes John Michael Riley of the Department of Agricultural Economics.
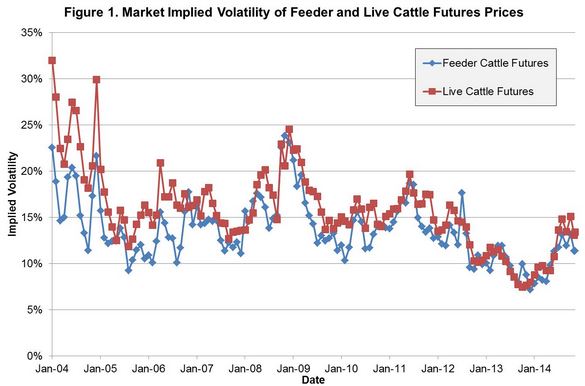
The timeline in figure 1 begins just after the high prices experienced in 2003 and the ensuing price decline following the BSE case. Implied volatility values were in the 20 to 33 per cent range in early 2004 for live cattle and 12 to 23 per cent for feeder cattle.
The increased volatility in 2008 and 2009 is also easily identifiable in figure 1 as implied volatility raced up to 25 per cent for both live and feeder cattle.
Recently, this measure began to decrease in mid-2012, falling to about 7 per cent one year ago. However, as prices have increased, so has volatility with feeder cattle futures price implied volatility at about 12 per cent and live cattle futures price volatility at about 14 per cent.
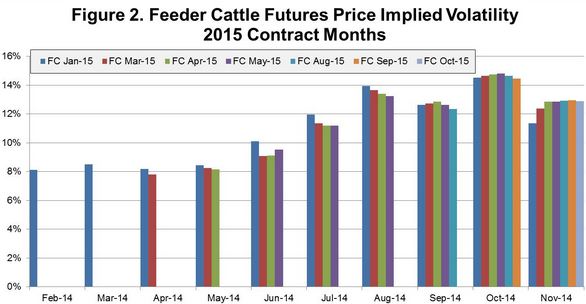
Specifically, looking more closely at feeder cattle price volatility for contract months in 2015, this phenomenon is no different.
As time passed and as contracts became available in 2014, implied volatility measures increased along with prices.
These peaked in August 2014, ranging from 12 to 14 per cent depending on the contract. Interestingly, the January 2015 contract carried more risk (i.e., a larger implied volatility value) than the more deferred contracts, but this has since been reversed.
Keep in mind that these deferred contracts typically traded below nearby months. In other words, futures market participants hesitated to push prices in very distant months to the high levels of those in more current months.


