

Feeds For The Future
On New Zealand dairy farms the more home-grown feed that is eaten per hectare the higher the operating profit per hectare. Opportunities to improve feed eaten have to be identified by David Chapman, DairyNZ Scientist, Dave Clark, DairyNZ Principal Scientist Farm Systems and Warren King, AgResearch.Introduction
These opportunities might include growing pastures or crops other than perennial ryegrass, in which case the risks associated with doing something different from perennial ryegrass must also be identified.
There are two main areas of opportunity: 1) exploit more of the potential that the environment offers for growing plant dry matter; and 2) reduce the difference between the amount of feed grown on the farm and the amount the cows eat (i.e. reduce pasture and crop wastage). The first area is about using other pasture species plus forage crops to complement the seasonal growth pattern of perennial ryegrass; the second is about managing ryegrass pasture more efficiently. There are management practices and species options available right now to tackle both of these.
What is the potential for growing feed in Taranaki?
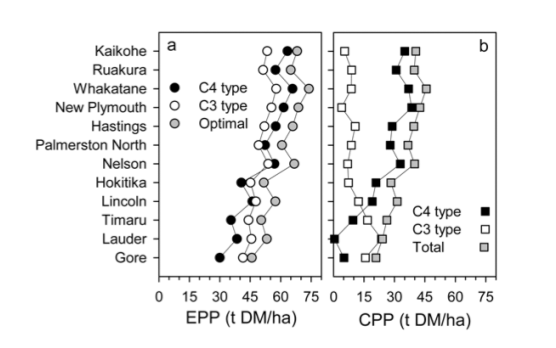
If all of the ground above one hectare of land was covered by a full canopy of leaves to intercept all of the sunlight falling on that area, then a temperate (C 3) crop like wheat could theoretically produce about 55 t DM per year on that hectare in a year, and a sub-tropical (C 4) crop like maize could theoretically grow about 62 t DM on that hectare in a year (Brown et al., 2007).
This is called the environmental production potential (EPP, Figure 1). These numbers compare favourably to the Waikato, where estimated environmental potential is 50 and 58 t DM/ha per year for C 3 and C4 species respectively. These very high numbers show that temperatures don’t limit plant growth severely, and that there is normally ample water available to support high plant growth rates.
Of course, it is impossible to have a full canopy of leaf material covering the ground surface all the time. Crops need time to germinate and develop to the point where all light is intercepted, and then they lose growth potential as they mature and leaves turn brown and no longer convert sunlight into new growth. Accounting for these factors gives us a more realistic picture of the best possible actual crop growth (called the crop production potential, CPP, Figure 1): which amounts to about 44 t DM/ha per year for Taranaki when maize and wheat are grown in a double-crop rotation.
- Geographical variation in annual environmental production potential (EPP) for C 4 and C3-type crops and a hypothetical optimum, which is the annual sum of the daily maximum of both crop types.
- Geographical variation in total annual crop production potential (CPP) and the CPP of each component of a hypothetical C 4/C3 system. From Brown et al. (2007)
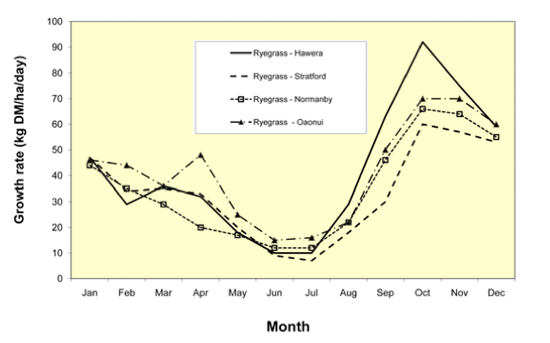
Pasture of course does retain green leaf cover over all of the area for all of the year (except if drought is experienced in summer, or if the pasture is over-grazed), so it is interesting to compare the figures above with pasture yields that have been measured in the region. DairyNZ’s Pasture Coach tool includes information on measured pasture yields for different regions. The information for Taranaki is shown in Table 1. The average of the four sites in the Table is 14 t DM/ha per year – which is about 32% of the crop production potential. The seasonal pasture growth curves for these sites are shown in Figure 2.
Table 1: Total annual pasture growth recorded at 4 locations in Taranaki. Years during which growth was measured are given in brackets.

Why is the figure for total annual yield of pasture so much lower than for crops? First of all, pastures are dominated by perennial ryegrass, which is a C 3 plant that is not nearly as productive in the warmer summer months as C 4 plants like maize, or even paspalum! So we miss out on a large chunk of potential yield in summer, but we do get quite good growth of high quality grass in winter and spring to support milk production in early-mid lactation. Secondly, unlike crops, pastures are grazed repeatedly, and each time the pasture is grazed it has to regrow new leaf to capture the sunlight, so there is always a dip in yield in the early stages of regrowth.
Figure 1: Seasonal pasture growth rates for different locations in Taranaki. Data are from Pasture Coach, and are for perennial ryegrass pasture.
Clearly there is scope to increase feed grown on farms in Taranaki. So what yields have been recorded from crops and pastures in the region?
A quick survey of papers published in the Proceedings of the New Zealand Grassland Association uncovered four studies conducted at TARS or Waimate West from which the relative seasonal production of different perennial grass species can be calculated. The results are summarised in Table 2. These studies all showed some potential for perennial grass species other than perennial ryegrass to increase seasonal, and total annual, yields. Adding together the best recorded yields from across those four studies in each season produces a figure for total annual DM production of 22.3 t DM/ha (second column from right hand side of Table 2) – nearly double the figure for perennial ryegrass from Pasture Coach for Normanby (12.86 t DM/ha, far left hand column of Table 2). Of course the 22 t DM/ha figure is a fabricated figure – the best total annual yield recorded was just under 19 t DM/ha for phalaris in the two-year study of Kerrisk and Thomson (1990). Still, this is a good deal more than what would be expected from perennial ryegrass if the long-term average figures are used.
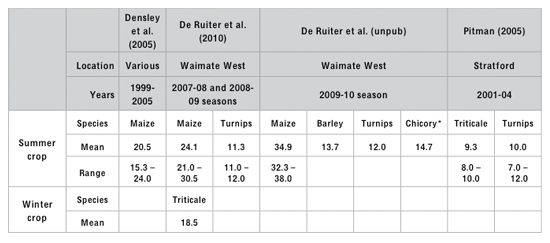
Similar information can be compiled for crops. In this case, the figures are presented just for the typical ‘summer crop’ period (roughly late October – March, when the long-term average pasture growth rate for Normanby adds up to a total of about 8.8 t pasture DM), or the ‘winter crop’ period (roughly April – mid October, 5.9 t pasture DM/ha according to long-term average). Maize consistently produced more than 20 t DM/ha, with the maximum recorded yield being 38 t DM/ ha, which is close to the theoretical potential formaize in Taranaki of 40 t DM/ha (Brown et al., 2007). Turnips consistently yielded around 11 t DM/ha in summer, while triticale was a successful winter crop in one study, producing 18.5 t DM/ha which is 3 times the expected pasture growth during the same period.
Table 2: Seasonal pasture growth (t DM/ha per season) measured for different perennial grass species
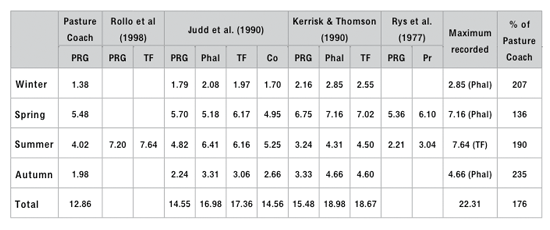
Table 3: Summer and winter crop yields recorded in trials in Taranaki
Work with what you’ve got: growing and harvesting more pasture
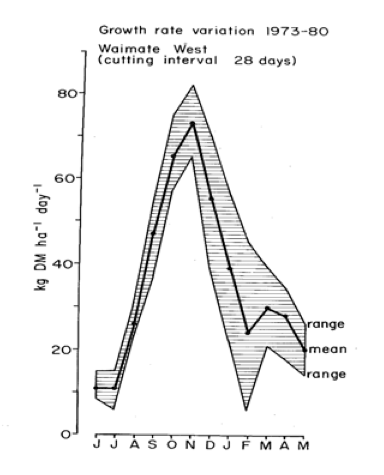
Table 1 suggests that a rough average pasture growth figure for Taranaki is about 14 t DM/ha for perennial ryegrass pasture, and Table 2 indicates it is possible to increase this by up to 50%. So how much pasture is actually consumed on Taranaki dairy farms? Figure 3 shows the distribution of pasture harvest achieved on 51 farms in Dairy Base in the 2008-09 season, and 36 farms in Dairy Base in the 2009-10 season. The average was 12.8 and 11.5 t DM/ha respectively, or around 82-90% of the long-term average for the region. Of course individual years result in quite different pasture growth (eg. Figure 4), so comparing the 2008-09 and 2009-10 seasons against the long-term average could be misleading. However, the figures show a distribution of harvest rates on-farm, with some farms doing very well, and some not so well.
Often up to one third of pasture grown is wasted. It is very difficult to see this waste occurring simply because dead leaves are continually overgrown by new leaves. The only sure way to maximise utilisation of home-grown is by accurate Pasture Assessment followed by calculation of a Feed Budget. Do you need information on what these are, or how to use them? Then go to: www.dairynz.co.nz - at the click of a button there is 50 years worth of pasture and animal research FREE. Much is self-explanatory, but if you need further help use 0800 DAIRYNZ.
Figure 3: Pasture eaten on farms in Taranaki in a) 2008-09 and b) 2009-10. Source: Dairy Base.
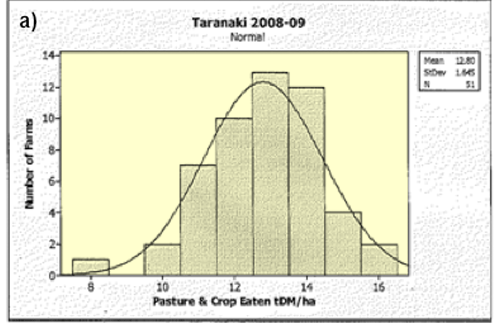
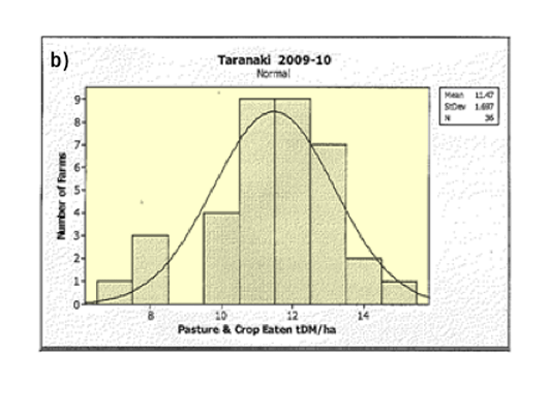
Figure 4: Variation between years in pasture growth rate. Example from Waimate West, over 8 years (from Baars 1982).
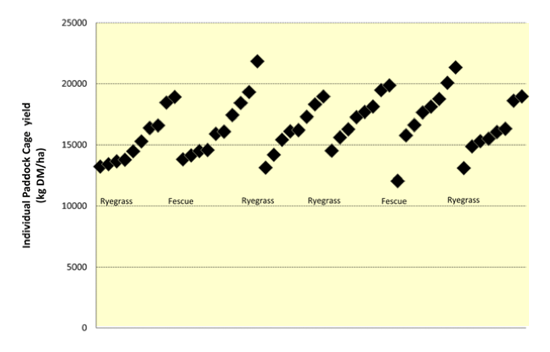
A lot can be achieved by using pasture assessment and grazing records to identify the best and worst performing paddocks. Even very uniform, high producing farms have large variations between paddocks. Figure 5 shows some results from three ryegrass and three tall fescue farmlets at the DairyNZ Scott Farm. Individual paddocks ranged from 12 to 22 t DM/ha/yr in the establishment year. Differential fertiliser use/effluent return may allow the yield of the worst paddocks to be lifted. Consider alternatives to ryegrass on the worst paddocks – try to identify why they are the worst paddocks BEFORE renovation. Some limitations to pasture yield can be removed e.g. drainage, nutrients, weeds, and some cannot e.g. slope and rainfall. Recognise that slope has a major effect on annual DM yield; once a slope is steeper than about 10 degrees yield will decrease by about 1 t DM/ha/yr for each 3 degrees of extra slope. No paddocks are poor producers simply because they lack high quality ryegrass seed – adding seed and changing nothing else will result in another poor paddock.
Figure 5: Variation in paddock yield for different ryegrass and tall fescue farmlets at Scott Farm, Waikato, in the establishment year. Each symbol is an annual paddock yield.
Some pasture options for TODAY
AR37 – this relatively new ryegrass endophyte has been shown by Errol Thom to be clearly more persistent than either AR1 or Standard endophyte grasses in experiments at DairyNZ. Although there was slightly lower milk yield from AR37 compared with AR1 during summer, this should not be seen as sufficient reason not to sow AR37 in any paddocks, farms or regions where ryegrass persistence is a problem. AR37 endophyte provides superior resistance to pest insect attack, including black beetle, Argentine stem weevil, root aphid and others. AR1 should not be considered in the black beetle zone (north of Taupo)
Sowing AR37 (or any novel endophyte) requires planning. Seed beds should be clear of resident standard endophyte ryegrass and seeds, do this by either spray/ploughing or spray/fallow/spray. Undersowing after hard grazing will not be successful. Avoid transfer of seed from standard endophyte paddocks to AR37 paddocks via hay or dung.
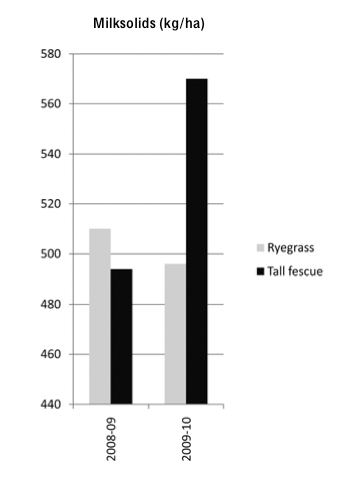
Tall fescue – the 25 t DM trial (Pastoral 21 programme) at Scott Farm in the Waikato has completed two seasons. The 100% tall fescue farmlet grew more pasture in the second year than the 100% ryegrass farmlet but milksolids were 20 kg MS/ha less (1325 vs. 1345 kg MS/ha). However, summer DM yield from tall fescue is better than from ryegrass in both years and this plant offers a viable alternative to ryegrass in any paddocks where ryegrass is struggling to persist. Tall fescue has a reputation for being difficult to control in spring/summer, however this has not been found so far, providing regular pasture assessment is done and grazing residuals are kept at 7-8 clicks on the pasture meter (< 1800 kg DM/ha).
Figure 6. Pasture growth (t DM/ha) for ryegrass or tall fescue +/- irrigation (Feb-Mar 2010)
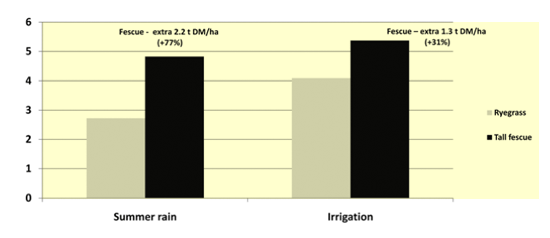
- In very dry conditions during summer 2009-10, without irrigation, tall fescue produced nearly 5 t DM/ha in Feb/March, 77% more than ryegrass. (Feb-Mar rain 93mm, irrigation application = 40 mm)
- Ryegrass responded better to irrigation than tall fescue but irrigated ryegrass still produced 1 t DM/ha less over this period than non-irrigated tall fescue (Figure 6)
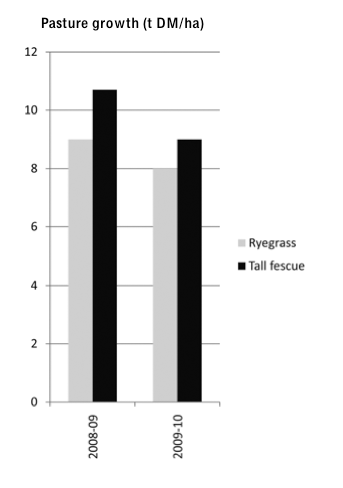
- In 2008-09 and 2009 in the 25 t DM/ha trial at Scott Farm, tall fescue has out yielded ryegrass in summer by 19 and 12% respectively (Figure 7)
- In 2008-09 of the 25 t DM/ha trial at Scott Farm, cows grazed on ryegrass produced 3% more milksolids in year 1 when all paddocks were irrigated, but cows grazed on tall fescue produced 15% more milksolids in 2009-10 when only 50% of paddocks were irrigated and summer rainfall much less (Figure 7)
- Over a full lactation, milksolids per ha for ryegrass was ahead of tall fescue by 4% in 2008-09 and 1.5% in 2009-10.
These herbs/legumes offer high quality summer-autumn feed. Their deeper root systems than ryegrass make them, along with tall fescue, a valuable option for paddocks where ryegrass is not persisting. They are winter dormant and this should be recognised when calculating what area to sow and in preparing feed budgets.
Recent results:- Late October sown chicory on the SuperProductivity Farmlet in the Waikato produced four grazings – total yield 16.7 t DM/ha from January to May
- December sown plaintain produced 20 t DM/ha in the establishment year
- Lucerne has the potential to grow 20 t DM/ha in the Waikato and offers a perennial alternative to chicory or plaintain.
Figure 7. Summer - autumn (December - April) pasture growth and milksolids from ryegrass or tall fescue
Some options for the FUTURE
Pasture growth rate is variable between years and between paddocks within farms. Alternatives to ryegrass are not widely accepted, because they require different management. OK – why don’t we give pasture away and just grow crops and feed cows indoors?
- Because although pasture provides a balanced diet for cows, most crops do not. For example, cows need crude protein (CP) levels of 16 – 20% for peak milk production but a crop mix of maize and oat silage would only provide 8-9% CP – large amounts of pasture or expensive high protein feeds would be needed to give a balanced dairy cow ration
- Cost.
- They will integrate pasture and crop systems in such a way that the benefits of both are captured
- They will reduce the cost of cropping and pasture renovation.
To develop these systems do we need to search the world for brand new crops? No. What we need to do is; use those we have got more effectively, genetically improve our existing plant species and remove the constraints to their performance.
In Taranaki, both Pitman (2005) and de Ruiter et al. (2010) found that, while markedly better yields of crops could be grown compared to standard ryegrass pasture (see Table 3), there was no overall economic benefit of adding cropping to the farming system. Similar conclusions have been reached in Australia. The problems appear to revolve around: the extra costs of growing and harvesting crops; achieving sufficiently high energy density in the harvested feed for high-producing cows; risks of missing the timing for optimal crop sowing and harvesting, for example due to adverse weather, or non-availability of contractors when required; and potential for high wastage rates of conserved feed. One rule of thumb that emerged from the 3030 project in Australia was that no more than 25% of total home grown feed should be conserved as silage: higher conservation requirements equal higher costs and risks, and the profitability of the system is lower. Direct grazing by cows is the most cost-effective method of harvesting feed, and forage plans for Taranaki dairy farms, indeed all dairy farms in New Zealand, should take this factor into account.
For more information:
- Autumn/Winter Feed Budget form
- Autumn/Winter Feed Budget calculator
- Average Pasture Growth Data
- Comparative Stocking Rate form
- Condition Score Recording Chart
- Condition Scoring for Dairy Herds Video
- Easy Pasture Cover Assessment
- Feed Information Poster
- Feed Wedge Ready Reckoner
- FeedPlan Pro
- Pasture Eaten Calculator
- Pasture Renewal Calculator
- Return from Feeding Supplement in the Autumn
- Spring Rotation Planner Calculators
- Summer Feed Budget Form
- Temperature Humidity Index (THI)
- Value of Feeding Supplements to Dry Cows for Condition Score (CS) Gain
- What's in spring pasture?

